One liner to show all colours available in R
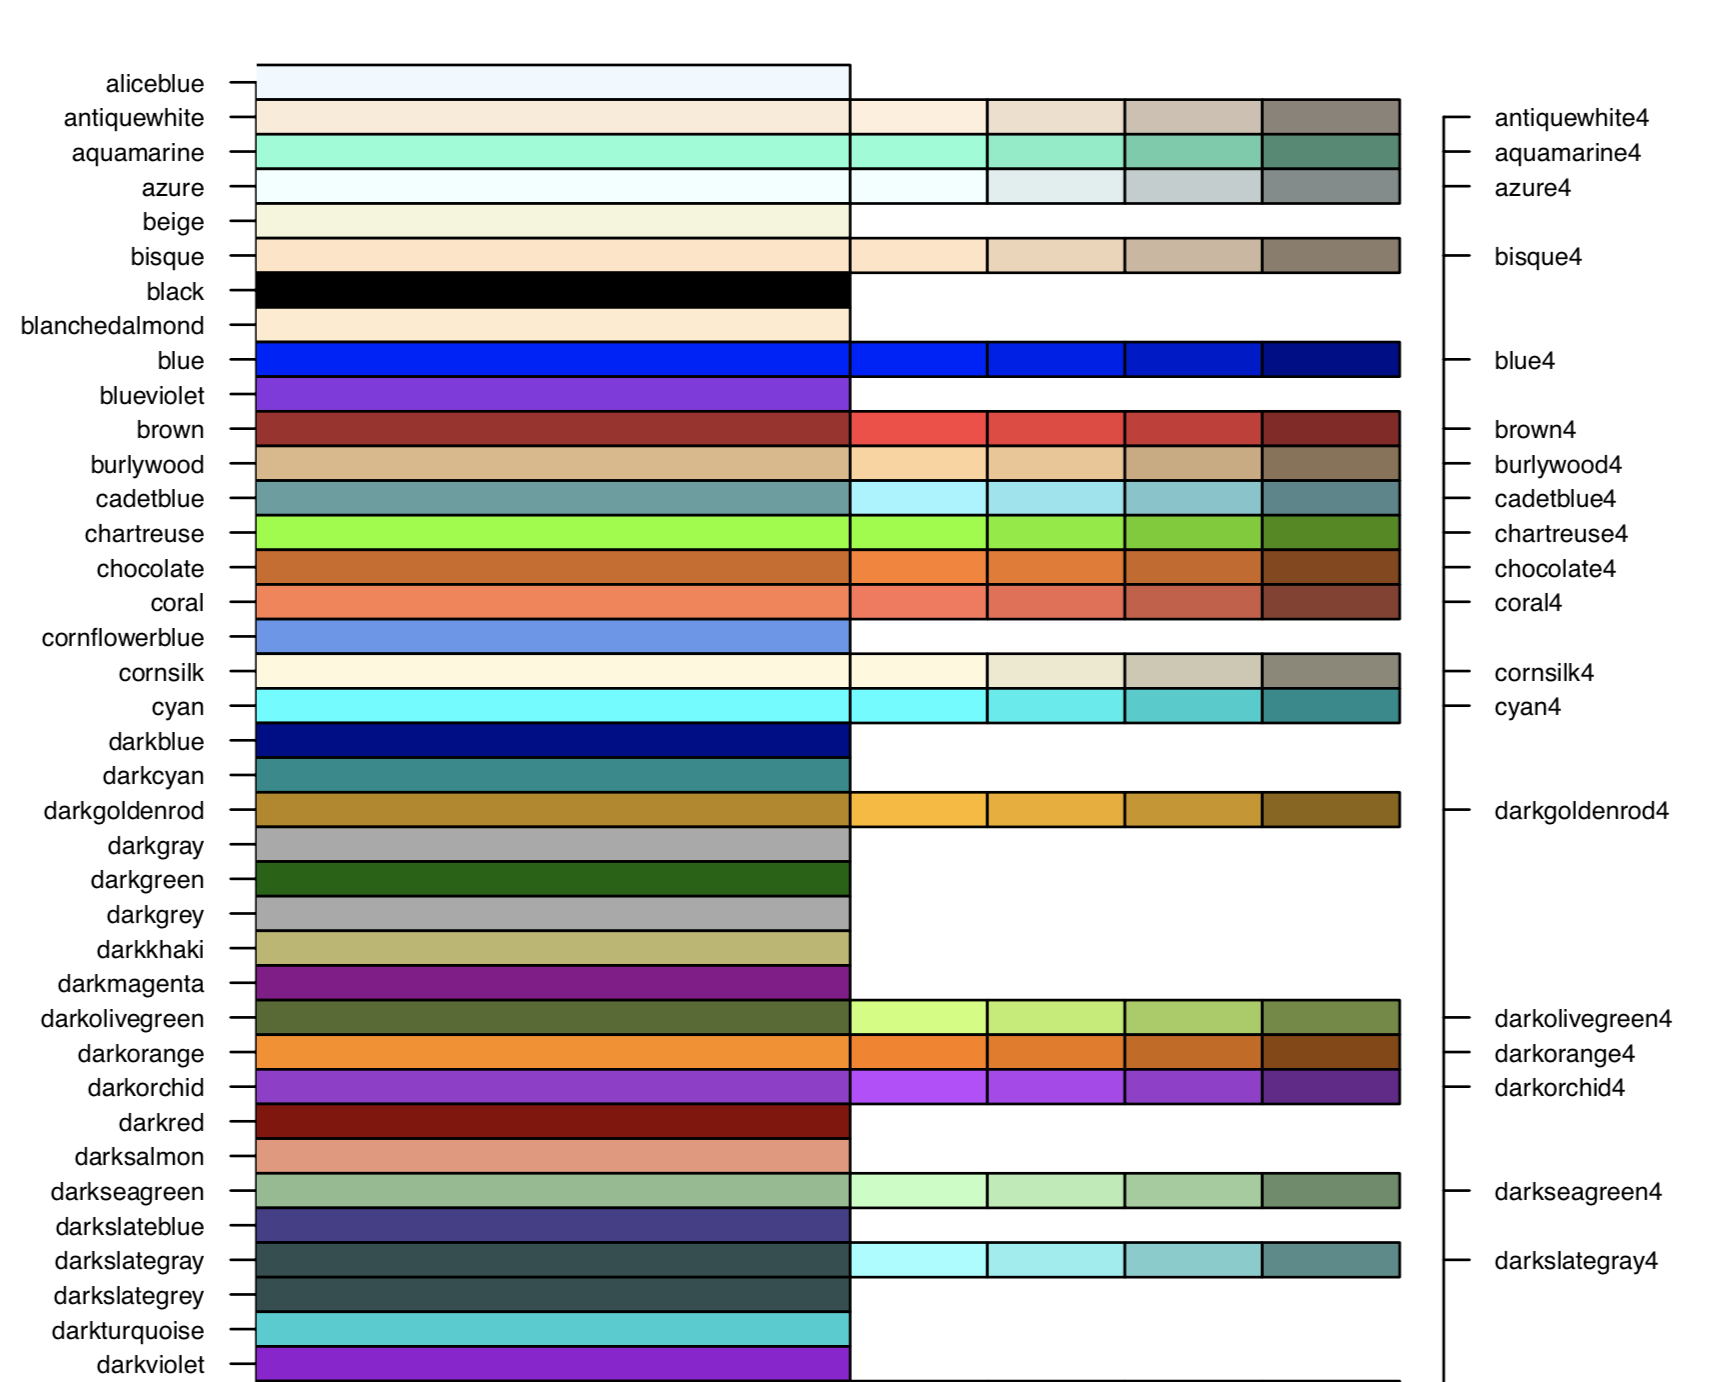
Some years ago, I came across a great little repo that contained R code to display all the colours available in R. You can source it as so:
source("https://raw.githubusercontent.com/hdugan/rColorTable/master/rColorTable.R")It creates a two-page PDF that looks like this:

Super nice.
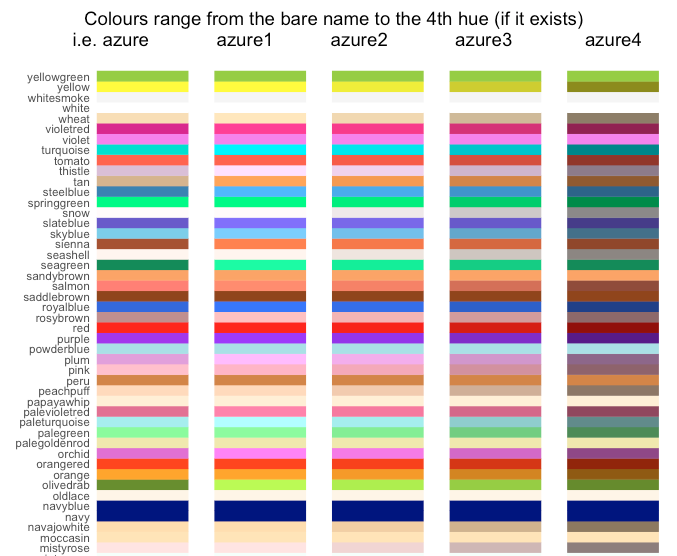
Back then, I thought it would be cool to see how to this with ggplot2, so I wrote a script that does that, you can see it here. It prints a plot that looks like this:

Lovely. You have to love those names…‘mistyrose’, ‘whitesmoke’…so nice. 👨🎨
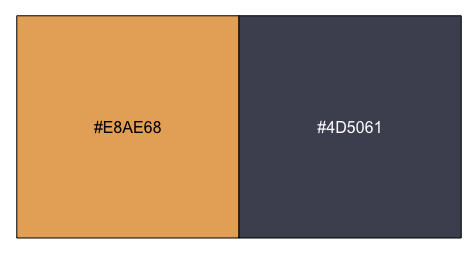
Anyway, I recently wanted to show the colours for a specific palette in the R console and I thought that there must be something new in the R universe to make this simpler, so after a little research, I realised the scales package has a lovely function, show_col(), which does exactly what I needed. I was comparing the colours #E8AE68 and #4D5061, which we can do easily:
scales::show_col(c("#E8AE68", "#4D5061"))
Fantabulous 🎨
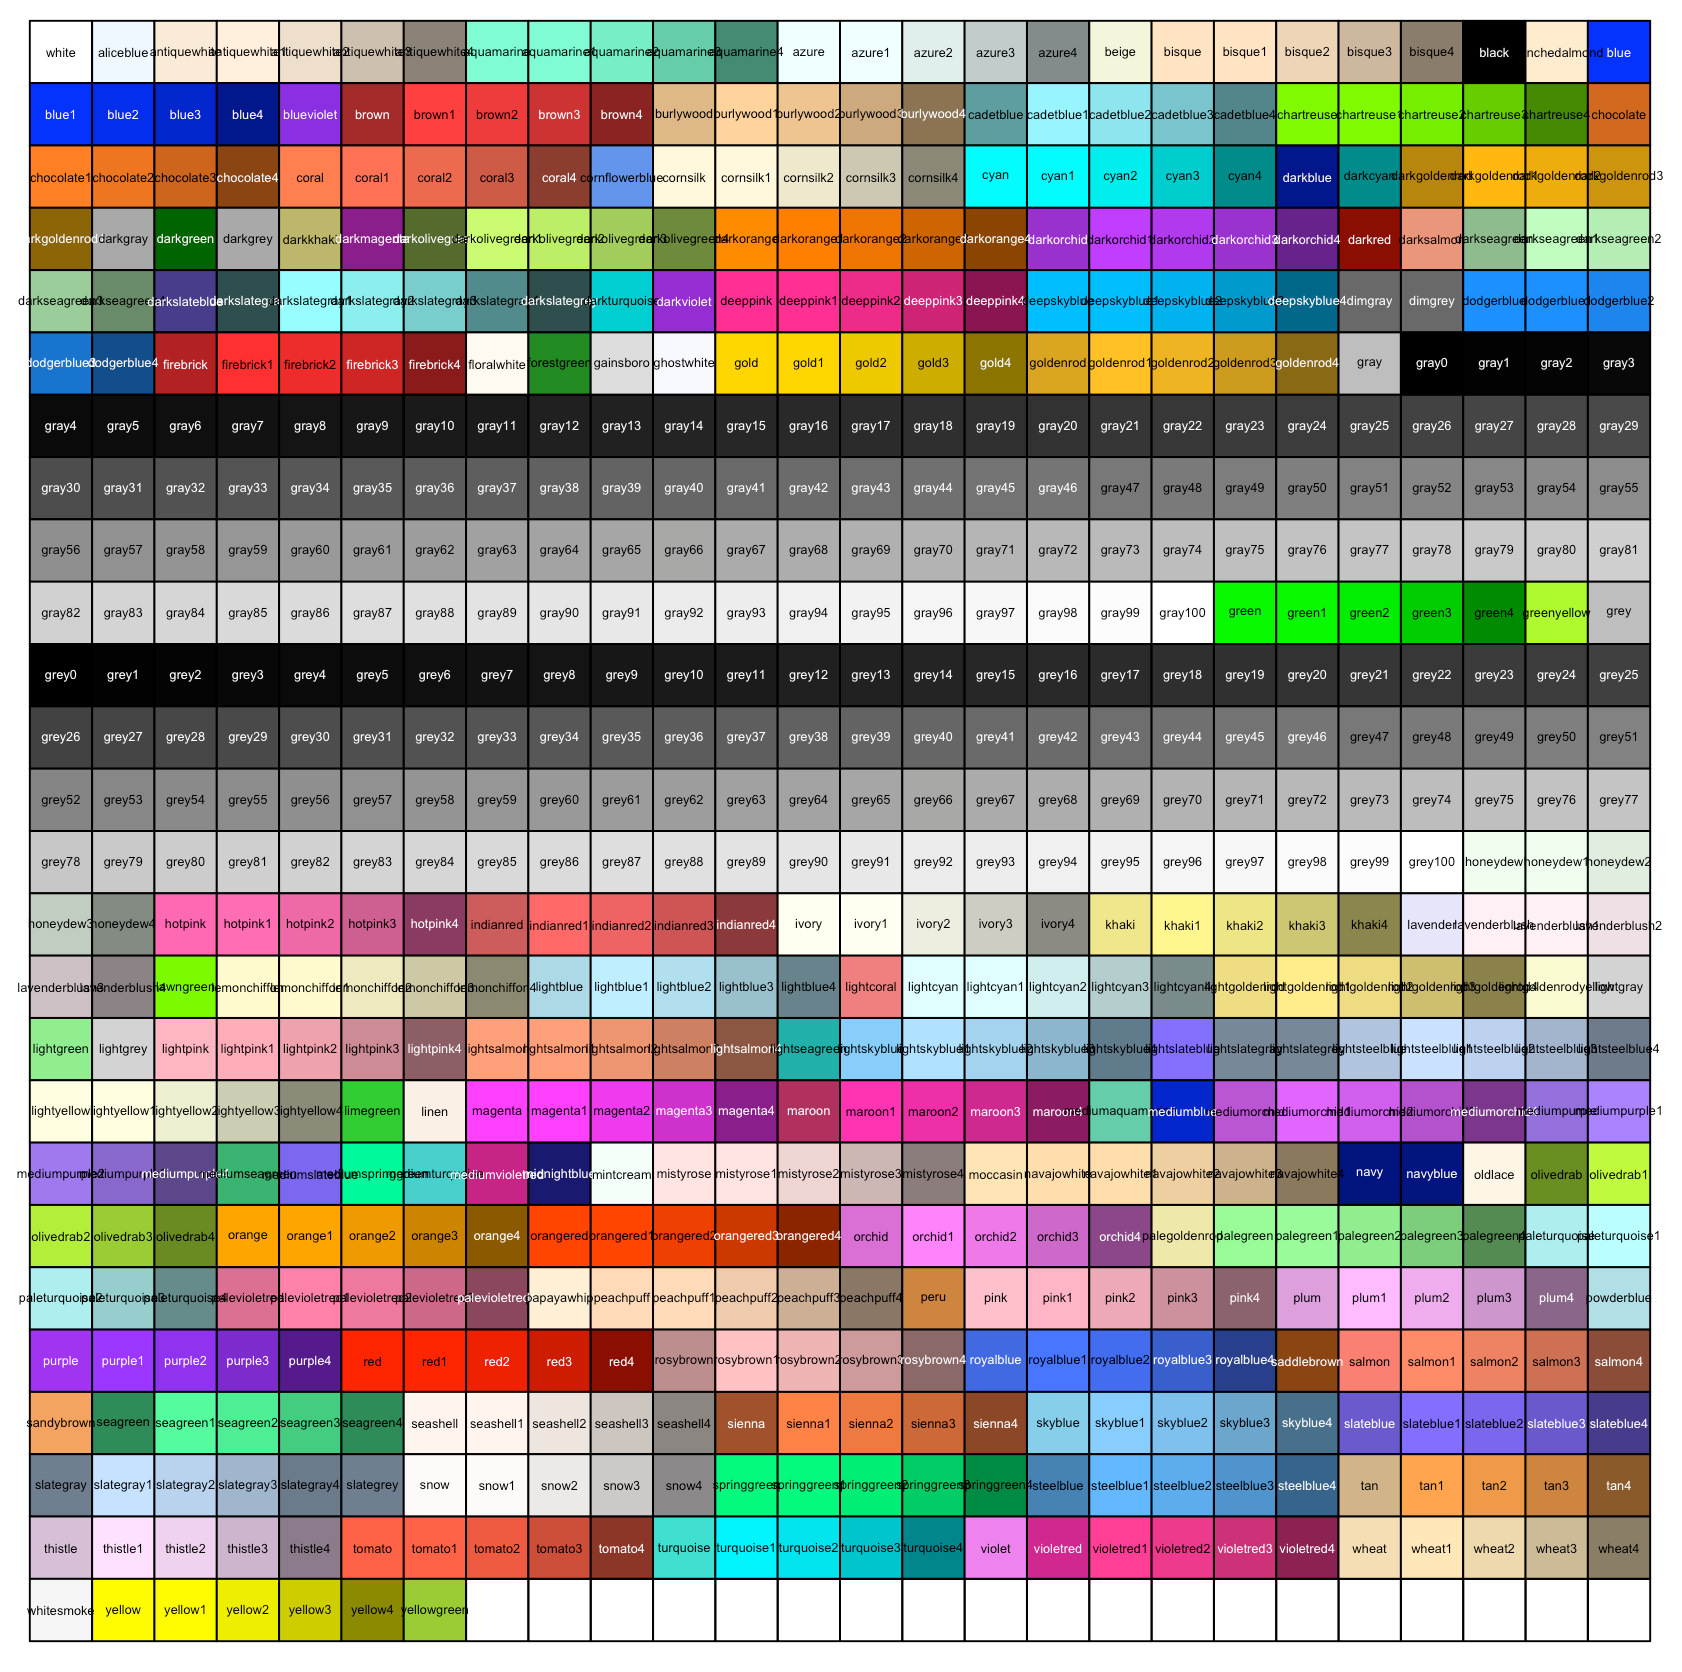
Then I thought, this could be one-line replacement for all that code I used to use to see all the R colours! Which it is:
scales::show_col(colours(), cex_label = .35)
Wowzers. You might have to mess with the cex_label parameter to get it juuuust right, but that’s not bad for one line of code. 👌